Dashboard
Overview of the ISPBills dashboard — key metrics, charts, and quick links
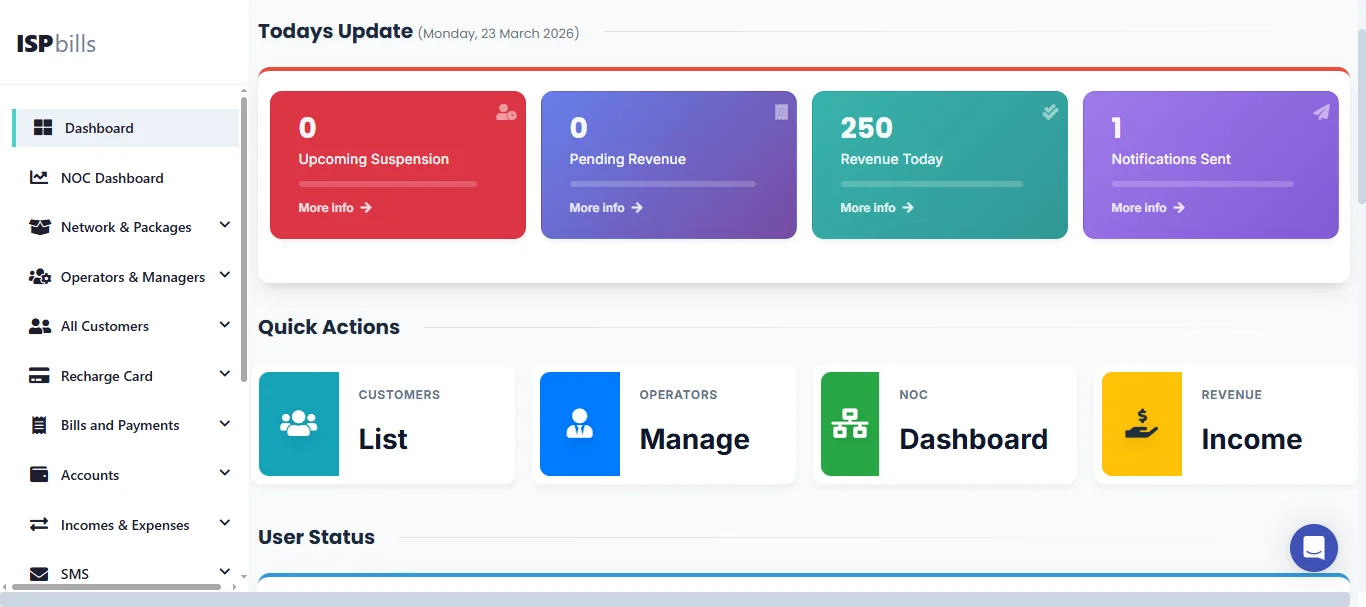
The dashboard is your operational command centre. As soon as you log in, it shows a real-time snapshot of your financials, customer status, and network activity so you can spot issues at a glance and take action immediately.
Every role in ISPBills has its own tailored dashboard. This page describes the widgets and charts available on the Group Admin dashboard (the most comprehensive view) and then highlights what differs for operators, sub-operators, managers, and the NOC dashboard.
The dashboard updates automatically. All figures reflect your own account scope; reseller and sub-operator totals are shown separately where applicable.
Overview
The dashboard is divided into three main sections:
- Top bar — financial summary cards showing today's key monetary figures.
- Status tiles — colour-coded counters for customer and messaging activity.
- Charts and quick links — visual analytics for trends, comparisons, and one-click navigation to detailed reports.
Together these sections give you a complete picture of your business without leaving a single page.
Financial summary
The top row displays four financial headline cards that update in real time.
| Metric | What it means |
|---|---|
| Accounts Receivable | Total amount due from resellers, managers, and sub-operators |
| Accounts Payable | Total advance balance held for prepaid resellers |
| Amount to be Collected | Total invoices with a due date of today |
| Collected Amount | Total payments recorded today |
These cards give you an instant health-check of your cash position. Click any card to jump to the corresponding accounting report.
Today's highlights
Just below the financial summary you will find two alert-style widgets:
| Metric | What it means |
|---|---|
| Customers Will Be Suspended | Subscribers at risk of automatic suspension today unless they pay or renew |
| SMS Sent | Number of SMS messages dispatched today across all channels |
Use the suspension count to proactively contact at-risk customers or issue reminders before service is interrupted.
Customer status widgets
The status tile area presents colour-coded counters for your subscriber base. Each tile is clickable and opens the matching customer list.
| Widget | Description |
|---|---|
| SMS Balance | Your current SMS credit. A low balance triggers a warning indicator. |
| Paid Customers | Subscribers with no outstanding bills — fully up to date. |
| Billed Customers | Subscribers who have unpaid invoices awaiting payment. |
| Customer Complaints | Count of unresolved support tickets across all departments. |
| Suspended Customers | Subscribers whose service is currently suspended due to non-payment or manual action. |
| Active Customers | Subscribers with an active service plan. |
| Disabled Customers | Subscribers manually disabled by an operator. |
| Online Customers | Subscribers connected and authenticated on the network right now. |
Keep an eye on the Suspended and Billed counts. A rising number may indicate billing-cycle issues or payment-gateway problems.
Charts
The lower section of the dashboard provides rich visual analytics. Each chart is interactive — hover for details and click to drill down.
Customer growth chart
A line or bar chart showing new customer registrations over time (daily, weekly, or monthly). Use this to track your acquisition trends and measure the impact of marketing campaigns.
Monthly registrations
Displays the number of new subscribers registered during each month of the current year. Compare month-over-month growth at a glance.
Customer status donut
A donut (ring) chart breaking down your total subscriber base by status:
- Active — currently receiving service
- Suspended — suspended due to non-payment or policy
- Disabled — manually disabled by an operator
- Expired — service period ended without renewal
This chart helps you understand the overall health of your customer base in a single view.
Online vs. Offline customers
A real-time comparison of how many subscribers are connected right now versus those who are registered but not online. The breakdown includes reseller sub-totals when applicable, so you can quickly spot if a particular segment has connectivity issues.
Bills vs. Payments (Due vs. Payment chart)
A dual-axis chart comparing the total amount billed against the total payments collected for each month. This is your key revenue-health indicator — a widening gap between bills and payments signals collection problems.
Cash In vs. Cash Out
An income-to-expense comparison chart. Cash In covers customer payments, subscription payments, and other credits. Cash Out covers expenses, refunds, and transfers. Use it to monitor net cash flow.
Paid vs. Billed customers
A side-by-side bar comparison of paid and unpaid subscriber counts. This provides a quick ratio check — ideally the "paid" bar should always be larger.
Quick-link cards
In addition to charts, the dashboard provides one-click shortcut cards:
| Card | Where it takes you |
|---|---|
| Payment Collection | Total collections for the current month — click to open payment records |
| Due | Total outstanding invoice amount — click to open the bills summary |
| Bills Summary | Full billing summary page |
| Payment Collections | Detailed payment records for the period |
| Incomes & Expenses | Income and expense section with category breakdowns |
| Customer Status by Reseller | Per-reseller view of active, suspended, and disabled counts |
Tip: Click any chart or card to navigate directly to the detailed report behind it.
Role-specific dashboards
ISPBills shows a different dashboard depending on your role. The sections above describe the Group Admin view, which is the most complete. Other roles see a subset tailored to their responsibilities.
Group Admin dashboard
The Group Admin (ISP owner) dashboard includes every widget and chart described on this page:
- Full financial summary (receivable, payable, collection, collected)
- All customer status tiles
- Every chart (growth, registrations, status donut, online/offline, bills vs. payments, cash in/out)
- Quick links to billing, accounting, and reporting pages
- Per-reseller and per-operator breakdowns
Group Admins also have access to the Business Dashboard — a separate page focused on revenue and growth metrics such as monthly recurring revenue, average revenue per user, and churn rate. Navigate to it from the sidebar under Dashboard → Business Dashboard.
NOC dashboard
The NOC Dashboard (Network Operations Centre) is purpose-built for network teams. Instead of financial widgets it focuses on:
- Router status — real-time online/offline status of all MikroTik routers
- Active problems — Zabbix alerts and status-check incidents
- Online customer count — live PPPoE/hotspot session totals
- OLT health — signal levels and ONU counts per optical line terminal
- Network topology — visual map of your infrastructure
Access the NOC Dashboard from the sidebar under Dashboard → NOC Dashboard (available to Group Admins and authorised operators), or directly within the NOC Panel for NOC users. For information on creating and managing NOC users, see NOC Role.
Operator dashboard
Operators see a dashboard scoped to their own customer base:
- Customer status tiles (active, suspended, billed, online)
- Today's collection and due amounts
- Charts for their own subscribers only
- Quick links to customer management, billing, and SMS
Operators do not see group-wide accounting figures or other operators' data.
Sub-Operator dashboard
Sub-Operators receive a simplified view similar to the Operator dashboard, limited to the customers assigned to them. Financial summaries and reseller breakdowns are not shown.
Manager dashboard
Managers see a permission-controlled dashboard. The widgets displayed depend on the specific permissions granted by their parent operator — for example, a manager with the receive-payment permission will see collection totals, while one without it will not. The dashboard adapts automatically based on assigned permissions.
Sales Manager dashboard
The Sales Manager dashboard focuses on lead tracking and operator onboarding. It shows self-registered admin counts, sales comment activity, and SMS status rather than financial or network widgets.
Tips for getting the most out of your dashboard
- Start each day here. The dashboard gives you a 30-second health check of your business.
- Watch the suspension count. Proactively reaching out to at-risk customers reduces churn.
- Use the Online vs. Offline chart to spot network outages affecting a specific router or area.
- Compare Bills vs. Payments monthly to catch collection trends before they become problems.
- Bookmark the NOC Dashboard if you manage network infrastructure — it is optimised for operational monitoring.
Related pages:
- Billing — detailed billing and invoice management
- Accounting — financial reports, journal, and ledger
- Monitoring — network device monitoring and status checks
- Customer Management — subscriber lifecycle management