NOC Dashboard
Overview
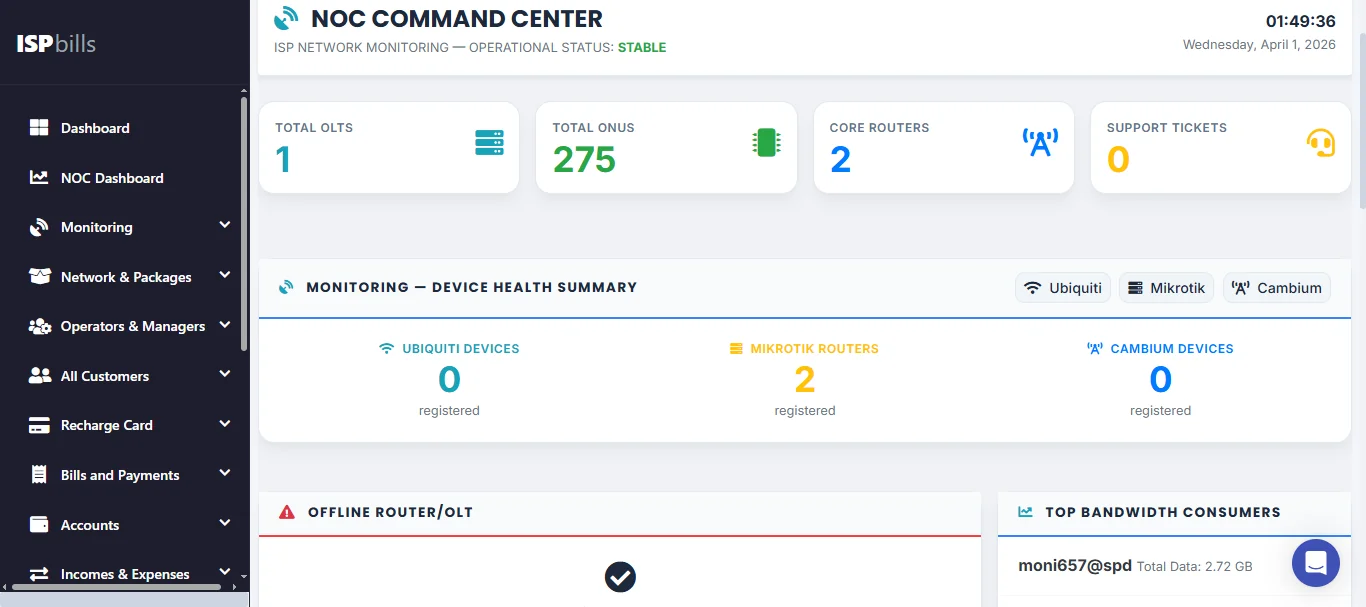
The NOC (Network Operations Center) Dashboard is the command-centre view of ISPBills — a single-pane-of-glass summary of your entire network's health and business operations. It is designed for network operations staff who need to assess the state of the infrastructure at a glance without navigating through multiple sections of the application.
Accessing the Dashboard
Click NOC Dashboard in the left-hand sidebar to open the dashboard. It is typically set as the landing page for NOC operator roles. The dashboard auto-refreshes at regular intervals so that the figures you see always reflect the current state of the network without requiring a manual page reload.
Infrastructure Summary
At the top of the dashboard you will find headline counters covering the key elements of your infrastructure:
- Total Routers — the number of routers registered in ISPBills.
- Offline Routers — routers that are currently unreachable; this figure should ideally be zero.
- Total OLTs — the number of Optical Line Terminals in service.
- Offline OLTs — OLTs that ISPBills cannot communicate with, indicating a potential fibre headend issue.
- Total ONUs — the aggregate count of Optical Network Units (fibre customer devices) across all OLTs.
Customer Status Counts
The dashboard breaks down your customer base by account state, giving you an instant picture of subscriber health:
- Active Customers — customers whose accounts are in good standing and receiving service.
- Suspended Customers — customers whose service has been temporarily suspended, typically due to non-payment.
- Disabled Customers — accounts that have been fully deactivated.
Monitoring these numbers daily helps you track churn and the effectiveness of your billing and collections process.
Top 10 Bandwidth-Consuming Users
A ranked table shows the ten customers using the most bandwidth during the current period. This is useful for identifying unusually heavy users who may be impacting network quality for others, and for informing capacity planning decisions.
Pending Complaints
The dashboard displays a count of open (unresolved) customer complaints. A rising number here is an early warning that a network issue or service degradation is generating customer-facing problems.
Recent Operator Actions
A feed of recent actions taken by operators within ISPBills is shown in the dashboard. This gives network managers visibility into what their team has been doing — configuration changes, customer account updates, device additions — without having to dig through the full access logs.