Monitoring
Real-time monitoring for routers, wireless devices, and fibre infrastructure
The Monitoring section gives you real-time visibility across your entire network infrastructure — from core routers and wireless access points to fibre OLTs, individual ONUs, and external monitoring services.
Monitoring features are available to Group Admins, authorised operators, and NOC users (with the view-monitoring permission). The NOC Panel provides a dedicated workspace for network operations staff — see NOC Dashboard for the consolidated view.
At a glance
| Area | What it covers | Sub-page |
|---|---|---|
| MikroTik Live Monitor | Real-time router status, interfaces, sessions, and configuration export | MikroTik |
| Ubiquiti Devices | airMAX / airOS device status, signal, and connected stations | Ubiquiti |
| Cambium Devices | ePMP / PMP / cnPilot device status, signal, and radio metrics | Cambium |
| OLT Management | Optical line terminal health, configuration, and ONU sync | OLT Management |
| ONU List | Per-subscriber fibre terminal status, signal levels, and mapping | ONU List |
| Network Topology | Visual map of your network infrastructure | Network Topology |
| Access Logs | Device and operator access audit trail | Access Logs |
MikroTik live monitor
The MikroTik monitor connects to your routers in real time and displays:
- CPU, memory, and storage usage — identify routers under heavy load.
- Interface traffic — RX/TX rates, errors, and drops for the busiest interfaces.
- Active PPPoE sessions — count of authenticated PPPoE users.
- Active hotspot sessions — count of connected hotspot clients.
- Wireless stations — signal strength, CCQ, and TX/RX rates per connected device.
- VLAN status — operational state of VLAN interfaces.
You can also export the running configuration of any router directly from this page and view router logs for troubleshooting.
➡️ MikroTik Monitoring details
Ubiquiti devices
Add and monitor Ubiquiti airMAX and airOS devices. ISPBills connects to each device and retrieves:
- Signal and noise floor (dBm)
- CCQ (Client Connection Quality) as a percentage
- TX / RX rates in Mbps
- CPU and memory usage
- Uptime
- Connected stations (when the device is in AP mode)
Devices are automatically enrolled in the status-check system when added, so you receive alerts if a device goes offline.
➡️ Ubiquiti Monitoring details
Cambium devices
Add and monitor Cambium ePMP, PMP 450, and cnPilot devices. Retrieved metrics include:
- RSSI, noise floor, and SNR
- Link quality and CCQ
- TX / RX rates and byte counters
- CPU and memory usage
- Uptime
- Connected subscriber modules / stations
Like Ubiquiti devices, Cambium devices are automatically added to the status-check system on creation.
OLT management
Manage your Optical Line Terminals (OLTs) from a single page. ISPBills supports multiple OLT brands including VSOL, DBC, ZTE, Huawei, and BDCOM. You can:
- View live OLT status — check whether the OLT is reachable and operational.
- Sync ONUs — discover and import all ONUs connected to the OLT.
- Download running configuration — retrieve and review the current OLT config.
- Open a telnet session — connect directly to the OLT CLI for advanced troubleshooting.
ONU list
After syncing ONUs from your OLTs, the ONU list shows every fibre terminal on your network:
- ONU identifier — MAC address or serial number.
- Port — the PON port the ONU is connected to.
- Status — online or offline.
- Signal level — RX power in dBm (helps identify weak links).
- Distance and temperature — physical diagnostics where supported.
- Mapped customer — ISPBills automatically maps ONUs to customers using MAC addresses and RADIUS accounting data.
Use the ONU list to quickly identify customers with poor signal or offline terminals.
Network topology
The topology page provides a visual map of your network infrastructure. You can:
- Add custom nodes (routers, switches, OLTs, access points) and position them on the canvas.
- Draw links between nodes to represent physical or logical connections.
- View real-time status indicators on each node.
This is especially useful for NOC teams who need a birds-eye view of the network during incident response.
Zabbix integration
If you use Zabbix for infrastructure monitoring, ISPBills can connect to your Zabbix server and display:
- Host list — all hosts monitored by Zabbix, with their current availability status.
- Active problems — open alerts with severity levels, so you can prioritise response.
Hosts and problems are synchronised automatically every five minutes. You can add multiple Zabbix servers and test the connection before saving.
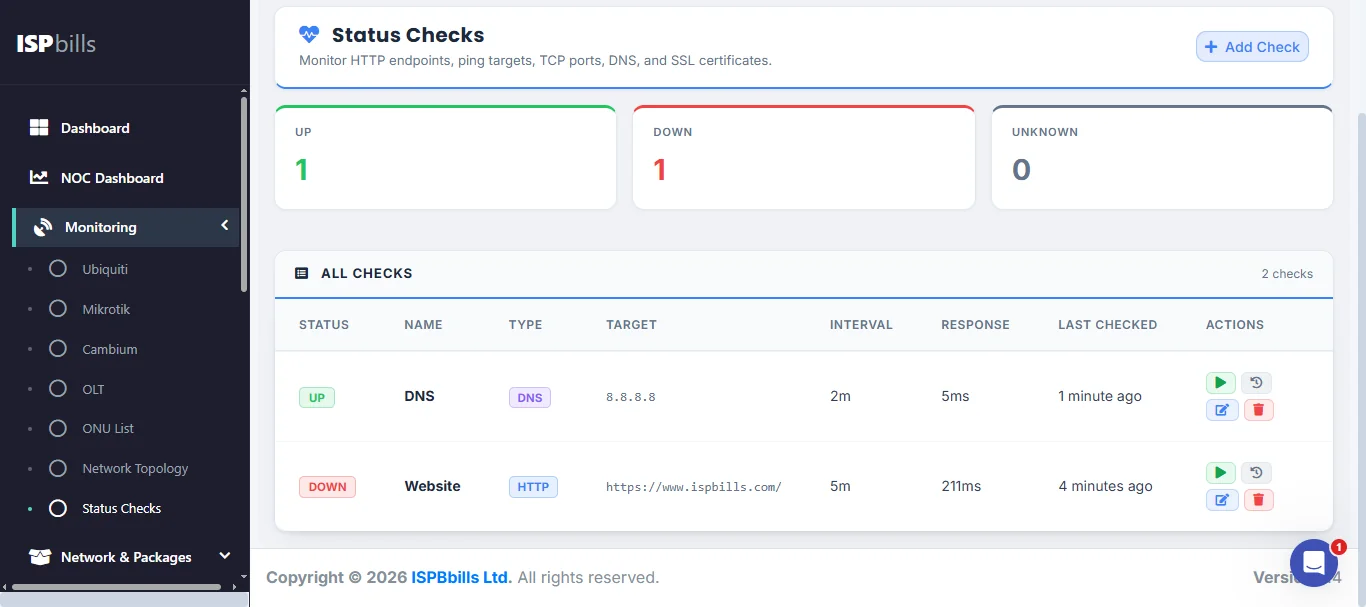
Status checks
ISPBills includes a built-in uptime monitoring system. You can create status checks for any device or service using the following check types:
| Check type | What it tests |
|---|---|
| HTTP / HTTPS | Web endpoint availability and response body matching |
| Ping (ICMP) | Basic reachability of any IP address or hostname |
| TCP | Whether a specific TCP port is open and accepting connections |
| DNS | Whether a domain name resolves correctly |
| SSL | Certificate validity — alerts when a certificate is expiring (< 7 days) or already expired |
| SNMP | Whether an SNMP agent is responding |
When a check fails, ISPBills creates an incident and optionally sends notifications. When the service recovers, the incident is automatically resolved.
Results are retained for 30 days, and you can view response-time trends and uptime percentages on the public status page — a page you can share with customers so they can check service health without contacting support.
NetFlow traffic analysis
ISPBills can collect and analyse NetFlow data from your MikroTik routers. Once configured, you gain access to:
- Top talkers — which customers or IPs are using the most bandwidth.
- Traffic breakdown — per-protocol and per-port analysis.
- Anomaly detection — automatic alerts when traffic patterns deviate from normal (potential DDoS or abuse).
- GeoIP enrichment — see which countries traffic is flowing to and from.
- Retention policies — configure how long flow data is kept before automatic cleanup.
NetFlow data is ingested via a lightweight collector and stored separately from your main database for performance.
RRD graphs
ISPBills generates RRD (Round Robin Database) graphs for per-interface traffic monitoring. These graphs update every five minutes and show historical bandwidth usage trends, making it easy to identify peak hours and plan capacity upgrades.
Access logs
The access logs page records every time an operator or administrator connects to a network device through ISPBills. This audit trail helps you:
- Track who accessed which router or OLT and when.
- Investigate configuration changes after an incident.
- Meet compliance requirements for device-access logging.
Tip: Devices added through the Ubiquiti, Cambium, or NAS (router) pages are automatically enrolled in the status-check system — no extra configuration needed.